Today's best Burlington oil prices
20 Seconds Can Save Burlington, VT Families $1,000+ On Oil Bills Every Year
Oil Prices in Burlington, VT
Updated on May 8, 2025 at 05:00 PM
| Heating Oil Company | Oil Price Per Gallon | Cash Discount | Volume Discount |
|---|---|---|---|
| Trackside Terminal Oil Co | Call for price | No | No |
| Global Co LLC | Call for price | No | No |
| Saratoga Olive Oil Co | Call for price | No | No |
| Champlain Oil Company | Call for price | No | No |
| Energy Coop of Vermont | Call for price | No | No |
| Abba Fuels | Call for price | No | No |
| Patterson Fuels | Call for price | No | No |
| Robinson's Inc | Call for price | No | No |
| Liberty's Fuel Oil LLC | Call for price | No | No |
| Rowley Fuels & Propane | Call for price | No | No |
| Northern Coal & Oil | Call for price | No | No |
| Trono Fuels Chittenden County | Call for price | No | No |
| John Leo & Sons | Call for price | No | No |
| Jolley 122 | Call for price | No | No |
| Chastenay Plumbing & Heating | Call for price | No | No |
| Joyal Fuels | Call for price | No | No |
| Jack F Corse Inc | Call for price | No | No |
Why Burlington Homeowners Choose Heat Fleet?
Quality Oil
On-Time Delivery
No Contracts
Secure Ordering
Pay Later
4 interest free payments with
Heat Fleet Champions Burlington Homeowners
We promote residential heating oil savings in Burlington by providing real-time Burlington heating oil prices and state-of-the-art secure online ordering.

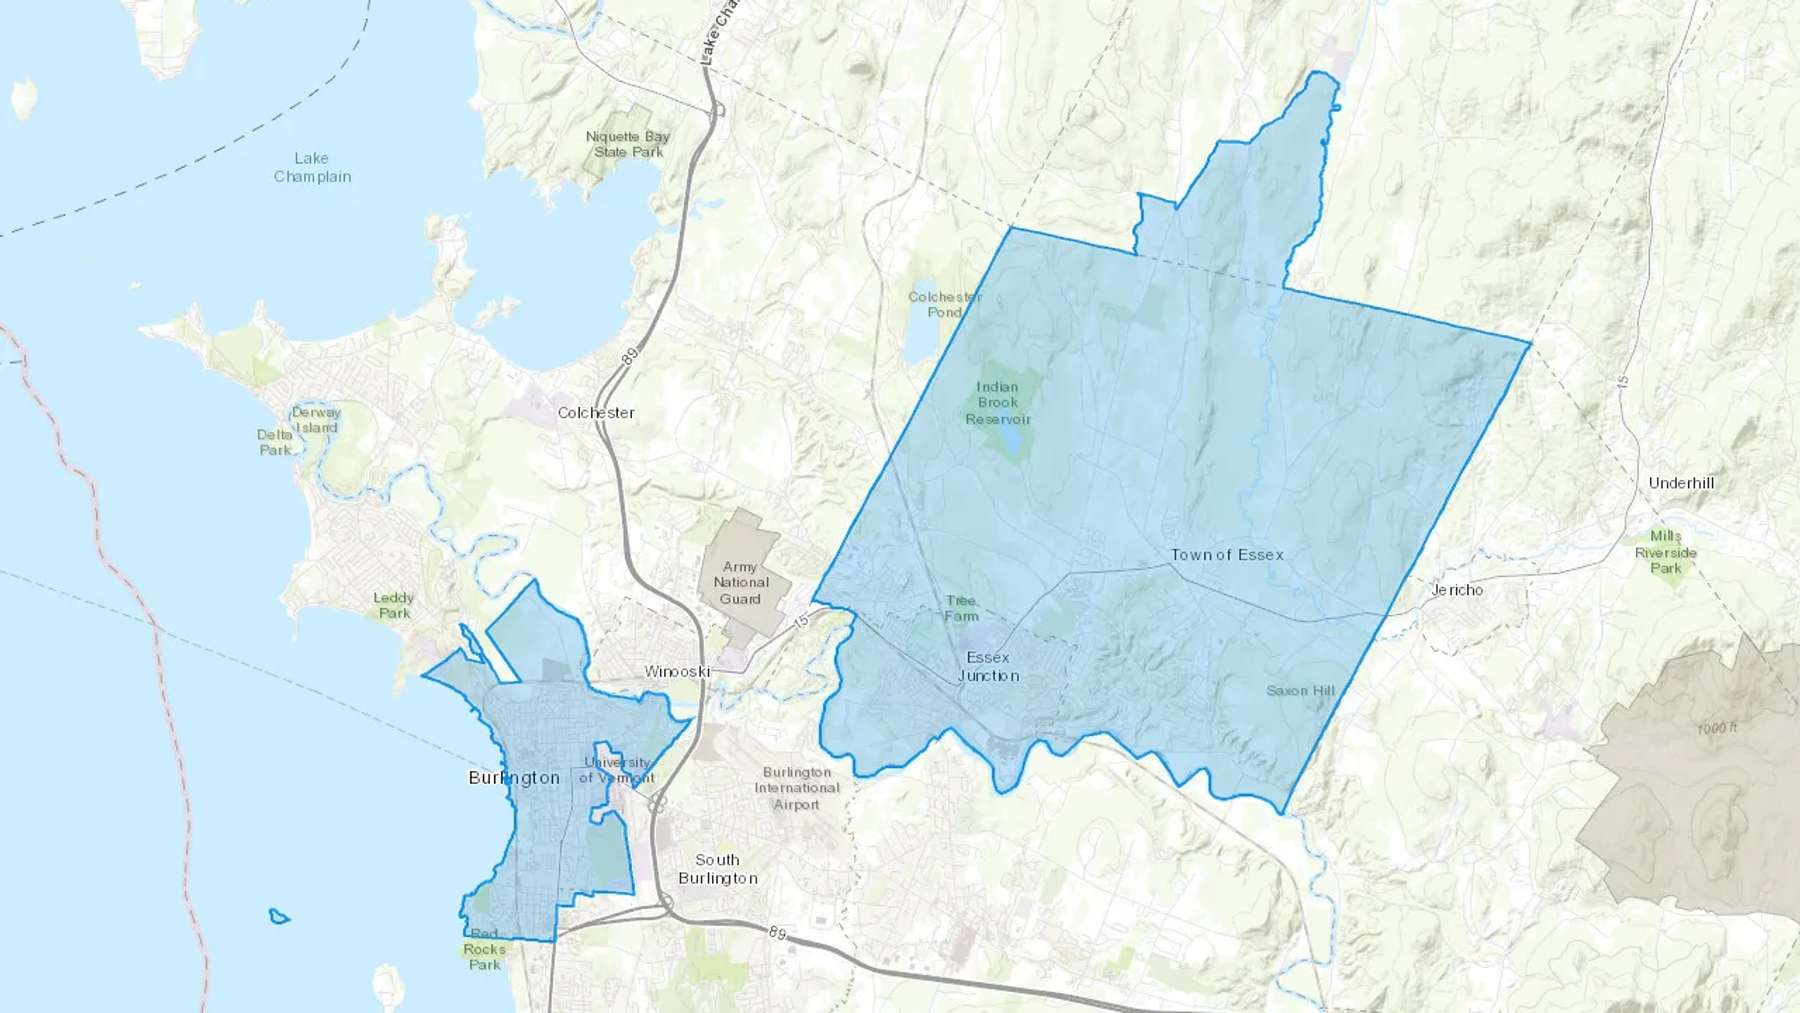
Burlington, VT Cash heating Oil delivery map

Propane vs. Natural Gas vs. Heating Oil: Burlington Home Heating Fuel Comparison
Homeowners have a variety of home heating fuels to choose from. Natural gas is the most popular choice in Burlington, used by 13,308 or 72.54% of homes. The 2nd most popular choice for Burlington homeowners is electricity, used by 3,386 homes (18.46%). The remaining homes are heated with heating oil (714), propane (604), no fuel (161), and other fuels (150).
Burlington Primary Home Heating Fuel Popularity by Number of Households
| Fuel | Burlington Households | % of Households |
|---|---|---|
| Natural Gas | 13,308 | 72.5% |
| Electricity | 3,386 | 18.5% |
| Heating Oil | 714 | 3.9% |
| Propane | 604 | 3.3% |
| No Fuel | 161 | 0.9% |
| Wood | 154 | 0.8% |
| Other Fuels | 150 | 0.8% |
| Solar | 129 | 0.7% |
Natural gas (72.5%)
Electricity (18.5%)
Heating oil (3.9%)
Propane (3.3%)
No fuel (0.9%)
Wood (0.8%)
Other fuels (0.8%)
Solar (0.7%)
#2 Heating Oil (Fuel Oil) Use in Burlington
Heating oil has become less popular in Burlington. In the 6 years since 2016, the number of heating oil homes fell from 1,242 to 714, a 42.51% drop.
Burlington Heating Oil Households (2011 - 2022)
| Year | Heating Oil Households |
|---|---|
| 2011 | 2,026 |
| 2012 | 1,821 |
| 2013 | 1,545 |
| 2014 | 1,378 |
| 2015 | 1,369 |
| 2016 | 1,242 |
| 2017 | 988 |
| 2018 | 892 |
| 2019 | 877 |
| 2020 | 826 |
| 2021 | 745 |
| 2022 | 714 |
Propane vs. Natural Gas use for home heating in Burlington
Between 2016 and today, the number of homes using propane as the primary space heating fuel fell from 754 to 604.
Between 2016 and today, the number of homes using natural gas as the primary space heating fuel fell from 11,681 to 13,308.
Electricity use for home heating in Burlington
Electric space heating systems are becoming more popular in Burlington. Since 2016, the number of homes heating with electricity rose from 2,143 to 3,386, a 58.00% increase.
Solar use for home heating in Burlington
Solar is the most environmentally friendly of all space heating fuels. With an “active” solar heating system, liquid is circulated between solar panels on a home’s roof and a heat energy storage tank in the basement.
Currently, 129 homes in Burlington are heated with active solar arrays. This is a 1190.00% increase from 2016, when only 10 homes had installed active solar heating.
Burlington, VT Heating Oil Trends
Last year, Burlington homeowners purchased a total of 606,142 gallons of heating oil. Out of the 124 towns in Vermont, Burlington ranks 40th for home heating oil consumption.
Country-wide, Burlington ranks 1300th out of 29,620 towns in America for heating oil consumption.
Short Term Trends
Burlington’s overall heating oil use varies from year to year, primarily depending on how cold each winter is. As the temperature outside gets colder, homes’ heating systems need to burn more and more oil to keep homes warm. Last winter in Burlington, the average outside temperature was 3.0° F colder than the prior winter's average outside temperature.
Burlington Average Winter Temperature
| Heating Season | Average Temperature |
|---|---|
| 2024 - 2025 | 28.1° F |
| 2023 - 2024 | 31.1° F |
Burlington, VT Heating Oil Delivery Overview
Approximately 714 households in Burlington, VT heat their homes with fuel oil. This makes oil delivery essential, especially when Burlington, VT temperatures drop as low as 42.5° F each winter.
3% of Burlington, VT Households Rely On Heating Oil Delivery Each Winter
| Burlington, VT Households | Burlington, VT Heating Oil Households |
|---|---|
| 18,345 | 714 |
17 Burlington, VT Oil Companies Go the Distance
With 606,141 gallons of heating oil delivered to Burlington, VT homeowners during the winter of 2024, the Burlington, VT community relies on its 17 oil companies to keep warm.
Oil delivery is a two step process: First, an oil truck picks up oil at the nearest bulk fuel terminal. In the case of Burlington, VT, two of the closest terminals are Apex in Rensselaer, NY and Buckeye in Albany, NY. Then, the truck delivers the #2 heating oil to homes and businesses in Burlington, VT.
Burlington Heating Oil Prices FAQs
What if oil prices change after I order, but before delivery?
Do I need to be home for the delivery?
How much oil should I order?
What is a “cash/check deal” and why is it cheaper than a regular credit card deal?